
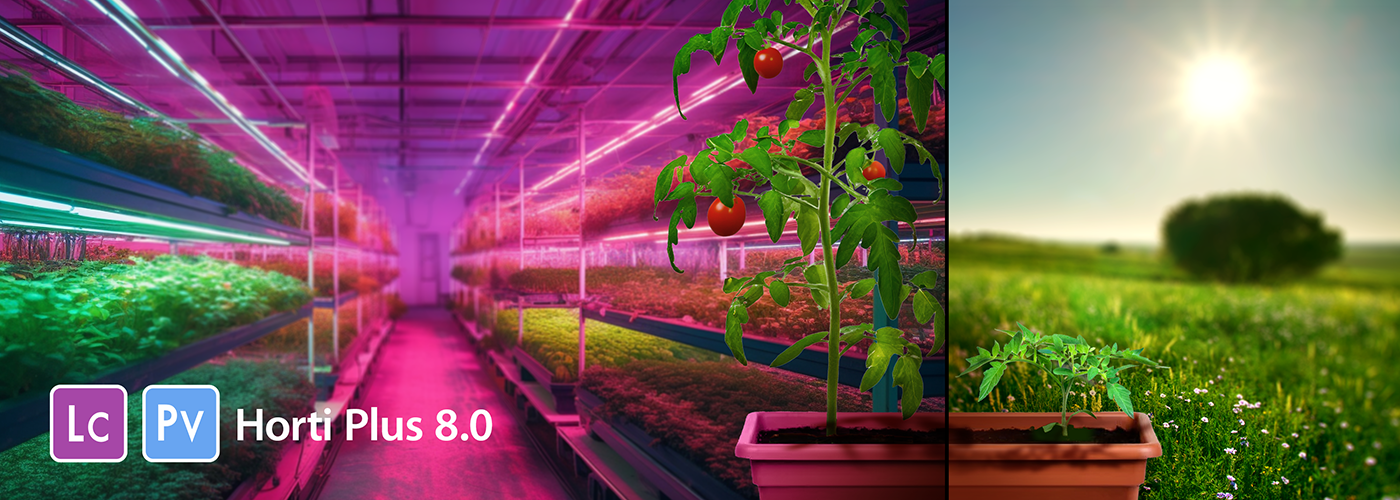
Photoview section for the management of photometric and spectrum data in the horticultural field (400-700 nm) of luminaires and light sources used for increasing and improving plant growth.
Horti Plus is the only program that:
- manages the PAR (Photosynthetical Active Radiation) units of the sector, thus avoiding laborious manual calculations
- saves data in XML files such as OXL or IESxml (IES TM-33)
Photometric and spectrometric data can be converted into, displayed as and printed as industry-standard graphs and charts.
The graphs and tables managed by Horti Plus are:
- spectrum graphs for the horticultural field
- spectrum graph and color plane according to the 3 typical configurations (CIE 1931 – CIE 1960 and CIE 1976)
- spectrum graph and evaluation chart of the various PAR parameters
- graphs for the McAdam analysis
- flux and power curves according to the current for LED luminaires
- polar and cartesian diagrams
- 3D photometry visualization
- beam opening diagram
- isolux and isocandela curves
- technical data sheet
- custom graphics
Horti Plus features an option to color the graphs according to the color coordinates of the measured spectrum.
Photoview is equipped with powerful functions for managing the PAR intensity matrices: refer to the Functions Summary / Photoview for further details.
Photoview Horti Plus is sold together with Litecalc Horti Plus for performing lighting calculations in the PAR field..
 Watch the introduction film about Horti Plus
References