Fundamental Parameters
Luminous Intensity
Definition: the luminous intensity is the quantity of light emitted by a point source in a given direction.
Symbol: I
Formula: luminous intensity can thus also be defined as the ratio between Flux dF emitted in a given direction and the element of solid angle dR.
Unit: cd (candela)
Technical Description: the candela is the luminous intensity, in a given direction, of a source that emits monochromatic radiation of frequency 540 x 10¹² Hz and that has a radiant intensity in that direction equal to Fi = 1/683 W / sr .
The steradian (sr) is defined as the solid angle that cuts off an area of the surface of the sphere equal to that of a square with sides of length equal to the radius of the sphere.
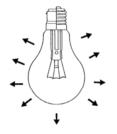
Luminous Flux
Definition: the luminous flux is the quantity of light emitted by a source in a unit of time.
Symbol: F (Fi)
Formula:
Unit: lm (lumen)
Technical Description: the lumen is the luminous flux emitted in unit solid angle by a uniform point source situated in the center of a unit radius sphere having a luminous intensity of 1 cd.
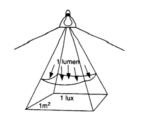
Illuminance
Definition: the illuminance is the quantity of light incident on a given surface.
Symbol: E
Formula: E = dF/dA
Illuminance can therefore be defined as the ratio between the flux emitted from the point source (F) and the area that receives this flux (A).
Unit: lux [lx]
Technical Description: the lux is the flux emitted by a point source distributed on a surface of 1m².
Luminance
Definition: the luminance represents the visual sensation perceived by the human eye if struck directly by the light produced by a luminous source or reflected from a surface: it can therefore be defined as the luminous intensity attributable to a surface.
Symbol: L
Formula: L = dI/(dS x cos(a) )
Where:
I = intensity in [cd]
S = surface area in [m²]
Cos(a) = direction cosine
Unit: cd/ m²
Technical Description: the luminance of a luminous object in a given direction is the ratio between the luminous intensity emitted by the object in that direction and the projection of the area of this object on a plane perpendicular to the direction itself.
Derivative Parameters
Luminaire Efficiency
Definition: the luminaire efficiency of a lighting fitting is given by the ratio between the flux emitted by the fitting (Fa) and that of the source or sources (lamps) contained in it (Fl).
Symbol: eta
Formula: eta = Fa / Fl
Unit: since efficiency is a ratio of 2 homogenous parameters it should be considered dimensionless
Note: Efficiency, in all practical situations, is always less than the unit.
Luminous Efficacy
Definition: the luminaire efficiency of a lighting fitting is given by the ratio between the flux emitted by the fitting (Fa) and that of the source or sources (lamps) contained in it (Fl).
Unit: lm/w
Tables and Graphics
Photometric Table
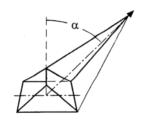
The photometric table shows the values of luminous intensity in cd/klm measured in different directions in space around the luminaire which is considered located at the center of a sphere of suitable diameter: generally the points at which the illuminances are measured and from which the luminous intensities are calculated with the inverse square distance formula are at defined angular distances, normally not constant.
Take a luminaire, for example for fluorescent lamps, with downward dark lite emission (there is no lateral emission); we can define the luminous area the area from which the light emits and the luminous axis the axis, obviously vertical, perpendicular to that area which passes through the meeting point (luminous center) of the diagonals of the luminous area.
At this point, placing the photoelectric cell of an illuminance meter on the luminous axis at a given distance from the luminaire we can determine the first value corresponding to Gamma = 0°.
Now take a half-plane coming from the luminous axis and directed transversally towards the luminaire lamps; we can call the half-plane C-0°. This half-plane constitutes the starting point of the other half-planes situated all around the luminous axis.
Moving the photoelectric cell along the C-0° half-plane with constant angular step, for example every 5°, in each position we obtain a new reading generally different from the previous ones, until arriving at Gamma = 90° (the photoelectric cell is situated laterally to the luminaire) where a dark lite luminaire no longer emits light (E = 0 lux).
The operation can be repeated along each of the infinite half-planes coming from the luminous axis: generally, however, it is usual to take into consideration the C-90°, C-180° half-planes or those with angular interdistances of 30° or 15°.
All the measured and converted values are summarized in a table (Photometric Table) according to the initial C- half-plane and relative Gamma angle.
The luminous intensities are calculated with laboratory readings by converting the values measured by the illuminance meter using the formula:
I = (E x d2) / F
Where:
- I = I = luminous intensity in [cd/klm]
- d = distance luminaire-photoelectric cell; this distance must be greater than 5 times the maximum dimension of the luminous volume or area so that the luminaire can be considered a point source (Far Field method not to be confused with the Near Field method)
- F = total luminous flux of the lamps in [klm]
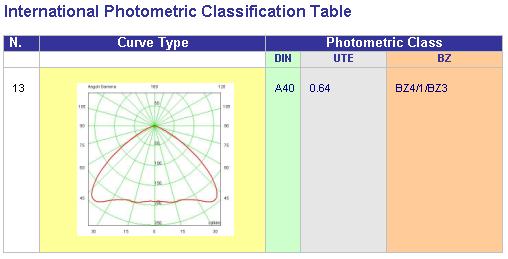
International Classifications
The classifications represent different ways of classifying luminaires according to their luminous emission.
The table shows 4 different classifications:
- CIE (Recommandation n.52)
- DIN 5040 (German Norm) (example A60)
- UTE C 71-121 (French Norm) (example 0.65A + 0.00T)
- NBN L 14-002 (Belgian Norm – method BZ) (example BZ2)
How to use the Photometric Classification Table with LITESTAR Liswin
- choose the curve of interest from the Table and check the photometric class code, A60 for a narrow downward beam for example
- enter the Parametrical Search and Data Update via Internet feature of LITESTAR Liswin
- choose the photometric class from the Photometric Parameters tag of LITESTAR Liswin and run the local or via the Internet search
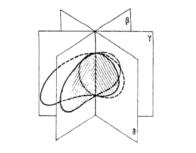
Polar and Cartesian Diagrams
The photometric table data are graphically represented by means of different photometric curves according to the type of coordinates employed:
- in polar coordinates
- in Cartesian coordinates
The first are used to represent luminaires in interiors and road installations, while the second better represent the emission from floodlights; this does not however mean that a luminaire cannot be represented in either way.
Polar Diagram (or Polar Curve)
The Polar Diagram is obtained by selecting a half-plane from the photometric table (for example C-0°), marking in the corresponding values of intensity and angle on the polar plane and carefully joining the various points.
The polar curve can also be seen as the cross-section of the photometric solid through a plane that passes through the luminous axis of the luminaire.
Cartesian Diagram
If the intensity values according to the Gamma angle are represented in terms of Cartesian coordinates (X-axis angles, ordinate intensity values) on a Cartesian plane and are carefully joined, the representation of the curve in Cartesian form is obtained (Cartesian Diagram).
Utilization Factor Tables
The utilization factor tables are useful for determining the number of luminaires of the same kind to be used within the room given an average illuminance value.
Elements in the Table
- Reflectance factors (example 8773): these are the reflectance factors of the ceiling, frieze, walls and work plane and are to be considered as percentages multiplied by 10 (example 80%, 70%, 70% and 30%)
- Room Index K (example 0.6): the room index is a factor that considers the dimensions of the room under examination
- Utilization Factors (example 340): these factors consider the amount of flux emitted by the luminaires falling on the work plane. The factors are expressed in thousandths (0.340)
Use of the Table
1. First of all, the reflectance value for ceiling, walls and work plane must be determined; in the case of walls with different reflectance factors an average value should be calculated
2. The room index corresponding to the room is calculated by means of the formula:
k = (a x b ) / ( Hu x (a + b))
where:
- a and b are the length and width of the room
- Hu is the working height understood as being the distance between the work plane and the luminaire
3. The utilization factor is determined as the intersection of the column corresponding to the chosen reflectance factors and the line of the calculated room index: where precise values are unavailable an average will have to be calculated
4. The average illuminance value desired is determined according to the type of activity to be carried out inside the room
5. The number of luminaires required to obtain the desired value of illuminance is calculated with the formula:
N = ( E x A) / ( F x Fu )
where:
- N = number of luminaires
- E = desired illuminance in [lx]
- A = a x b = total area in [m2]
- F = total flux of the individual luminaire in [lm]
- Fu = utilization factor
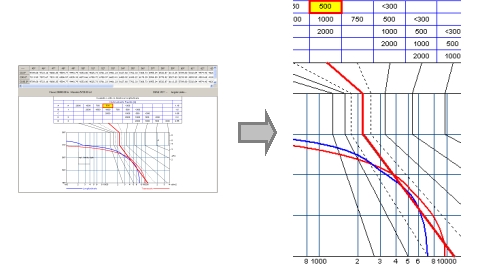
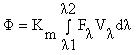
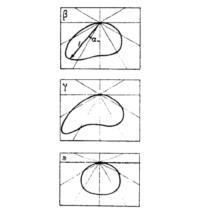
Soellner Glare Diagram
The abacus of Söllner is useful for characterizing the direct glare of an installation.
Use of the Abacus
The upper part of the diagram shows the CIE and DIN classification where the degree of glare allowed for the installation should be selected; from the average illumination table of the installation the required average value is chosen from which you follow down to find the luminance limit line.
The diagram also shows the luminance curve of the luminaire: if this is situated wholly to the left of the curve limit the luminaire corresponds to the required glare category, whereas the luminaire will dazzle if they intersect or the curve is wholly to the right.
The diagram shows the luminance curves in longitudinal and transversal directions; the luminance values according to the angles of observation are illustrated in the table below the diagram.
Glare Category Classes
- A > Extremely difficult
- B > With high visual performance
- C > With normal visual performance
- D > With limited visual performance
- E > To be considered as work zone where the work requires poor visual performance