The
photometric table data are graphically represented by means
of different photometric curves according to the type of coordinates
employed:
- in polar coordinates
- in Cartesian coordinates
The first are used to represent luminaires
in interiors and road installations, while the second better
represent the emission from floodlights; this does not however
mean that a luminaire cannot be represented in either way.
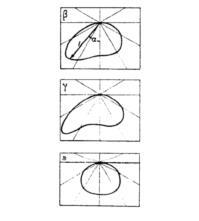
Polar Diagram (or Polar Curve)
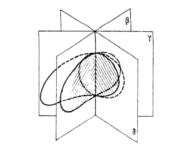
The Polar Diagram is obtained by selecting a half-plane from
the photometric table (for example C-0°), marking in the
corresponding values of intensity and angle on the polar plane
and carefully joining the various points.
The polar curve can also be seen as
the cross-section of the photometric solid through a plane
that passes through the luminous axis of the luminaire.
Cartesian Diagram
If the intensity values according to
the Gamma angle are represented in terms of Cartesian coordinates
(X-axis angles, ordinate intensity values) on a Cartesian
plane and are carefully joined, the representation of the
curve in Cartesian form is obtained (Cartesian Diagram).
|